Looking for help?
Features:
- Colors: Red means bearish, Blue/Green means Bullish
- Trend Checking
- Checking Higher Time Frame Trend: On any time frame that you are looking at on your chart, VATA Envisage Algo show higher time frame, medium time frame and local (smaller time frame trend).
- Over Bought/ Over Sold conditions
- Signals
- Gaps
- End Of Trend Support/Resistance levels
Features Explanation:
- Trend Assessment:
- VATA Curve: Shows higher time frame trend. Red means bearish, Green/Blue means bullish
- VATA Trend (Bottom Indicator): Shows medium time frame trend. Red means bearish, Green/Blue means bullish
- VATA Channel: Shows higher time frame trend. Check its direction. This channel also shows over bought and over sold condition which we will discuss later below.
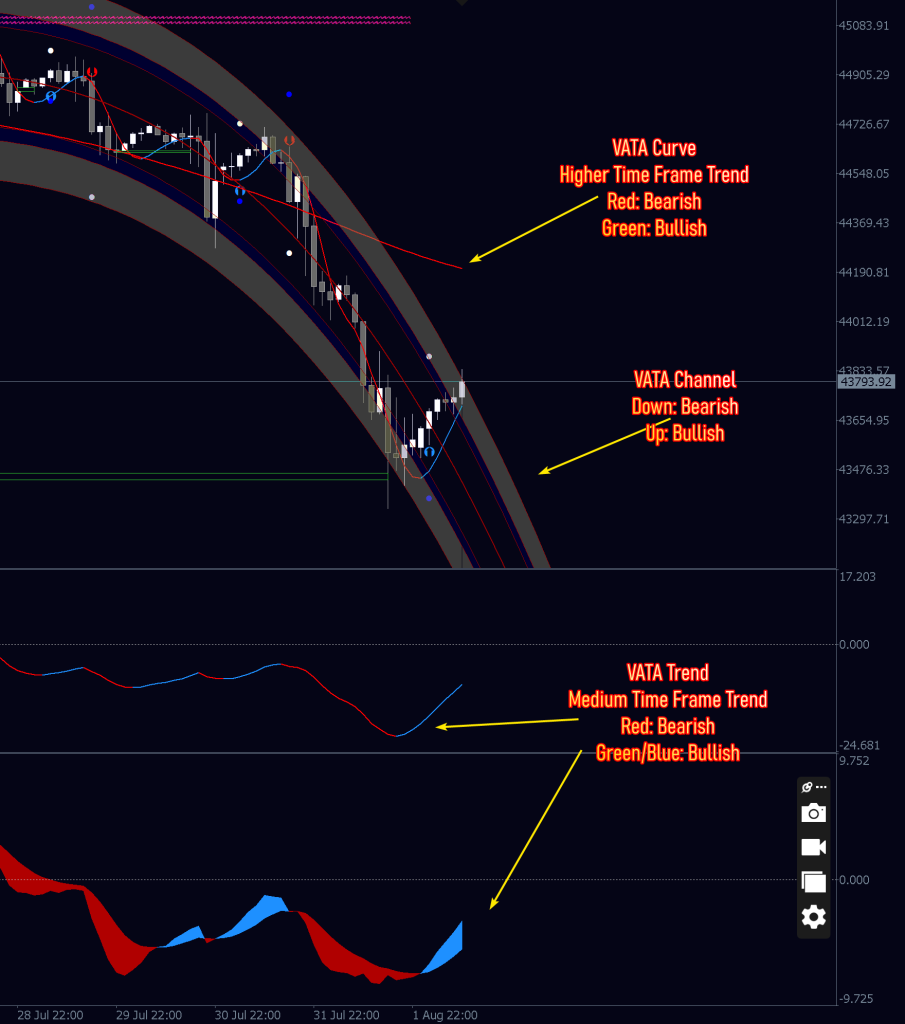 In the example screenshot above as VATA Curve is red, higher time frame trend is bearish. Channel is pointing down wards that also indicates that the price is bearish. However the VATA Trends (medium trend) is blue hat means price bounce up for a correction against the bearish trend. This gave us a good Counter Trend long opportunity. If you do not want that, wait for the VATA Trend to become red again and then plan for a short.
- Over Bought/Over Sold Conditions:
- The VATA Channel allows us to estimate if the price is over bought or over sold.
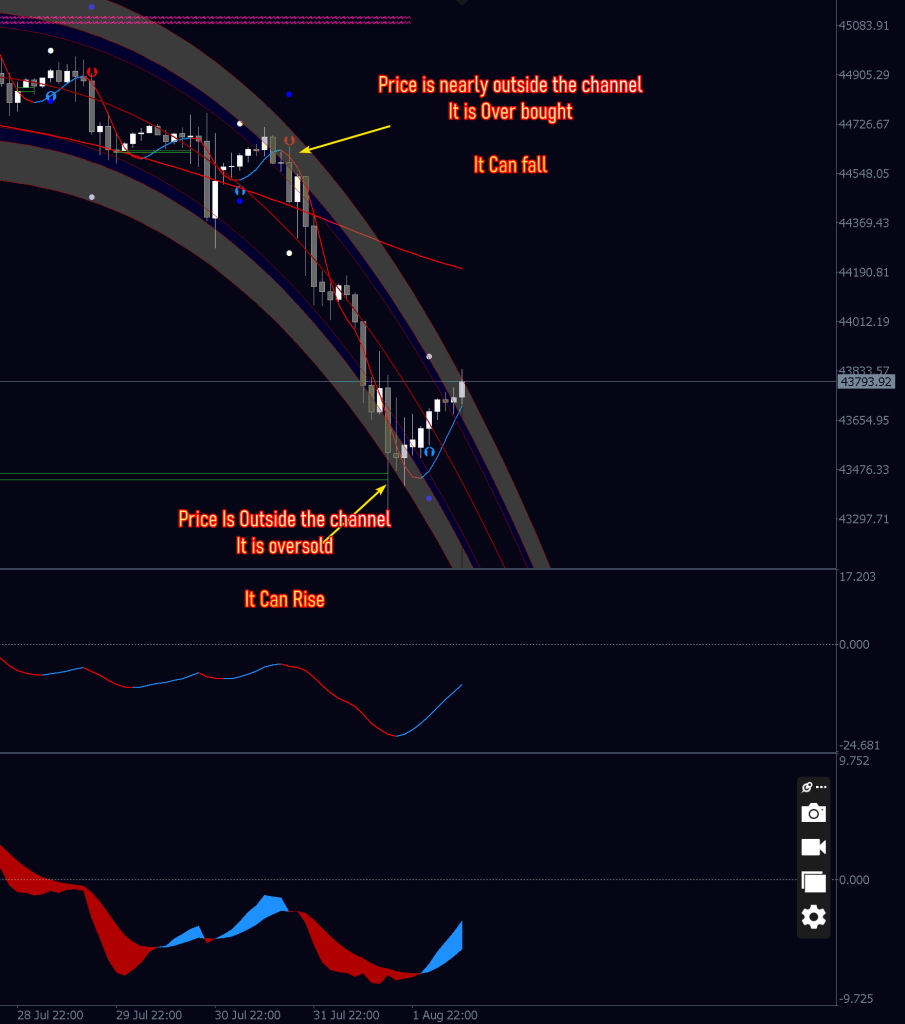
In the above example, whenever the price comes out the channel, it becomes over sold/over bought. That tells us in advance that price is about to reverse.
- The VATA Channel allows us to estimate if the price is over bought or over sold.
- Signals
- There are red and blue arrows to depict the entry signals. You can either enter aggressively (as soon as the arrow appears) or cautiously (after the arrow candle has closed) depending on your trading style. Remember the the signal is not finalised until the candle is closed though. So we always suggest to wait for the candle close i.e. enter cautiously.
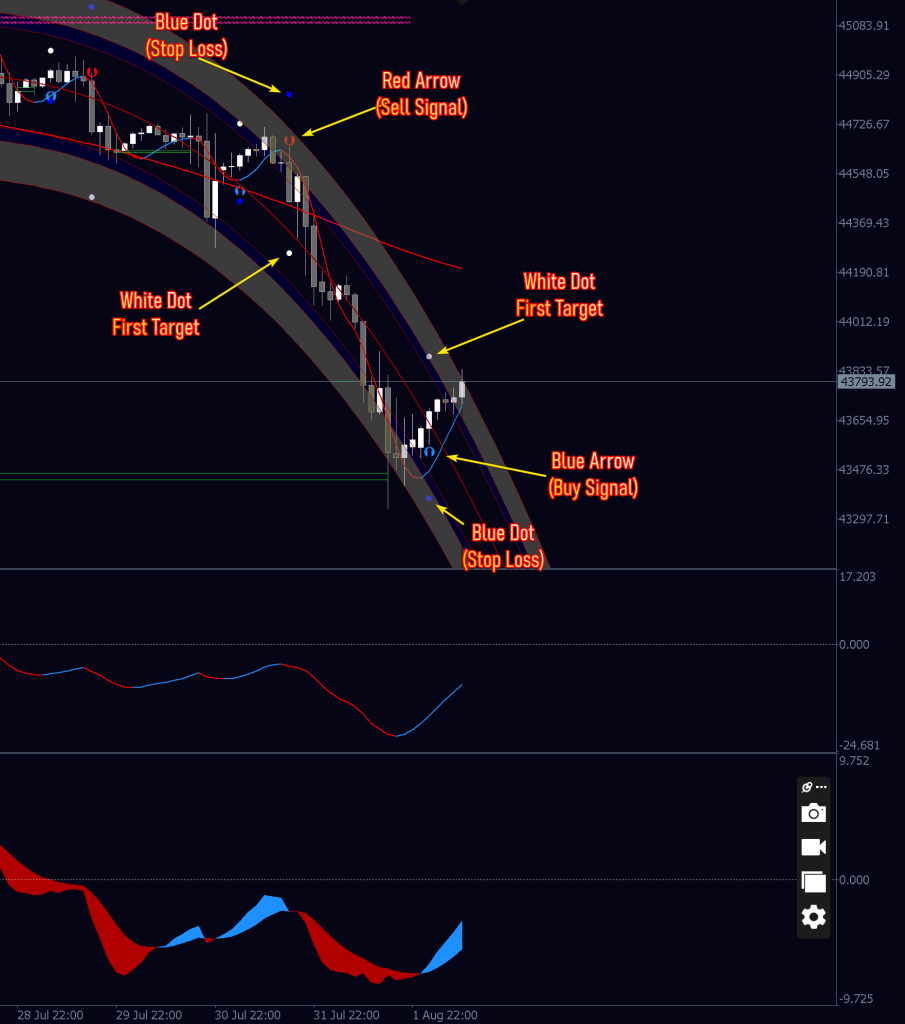
- Red arrow means sell signal, Blue arrow means buy signal.
- Not all signals are profitable hence you must take signals only when the conditions are right. For example if the price is over bought i.e. outside the channel, it is likely to reverse and sell. So if a red arrow appears and candle closes, we can try to take a short. We can similarly take a buy signal if the blue arrow appears when price is over sold.
- The table below should help a bit in identifying which arrow to use and when.
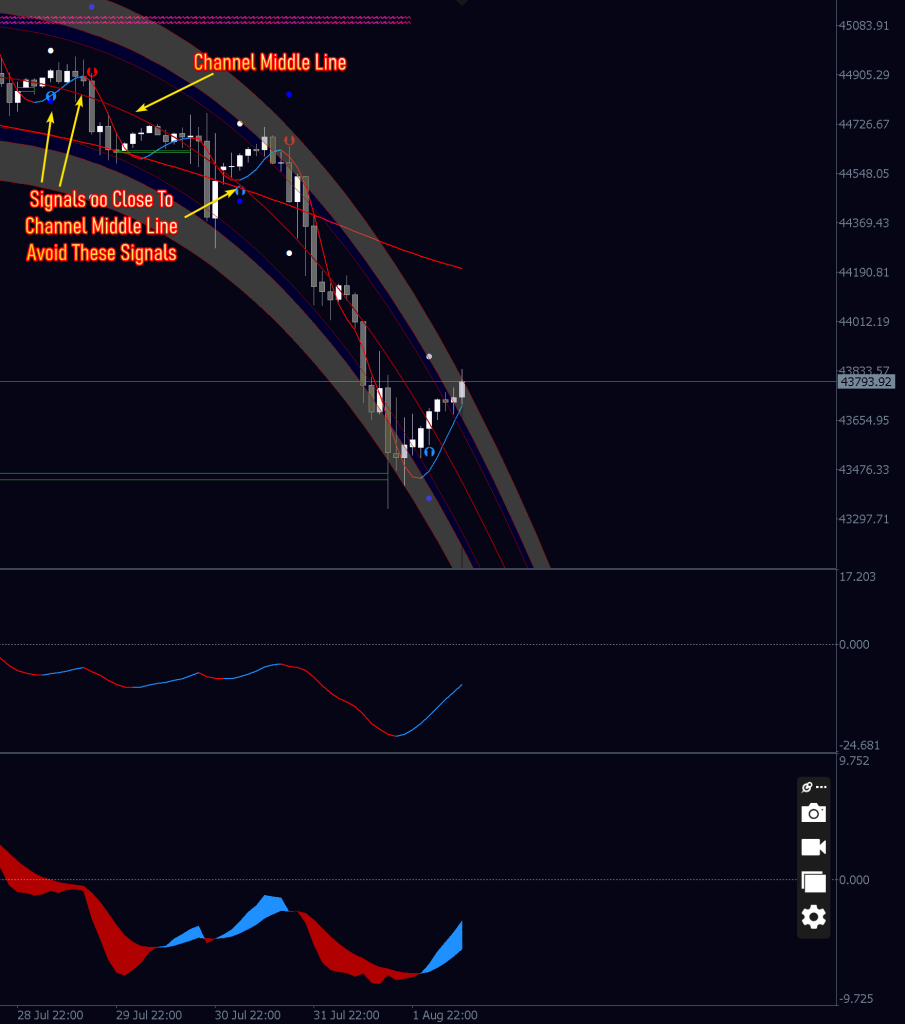
Action Condition Arrow BUY Market Over Sold Blue BUY Market At Support Blue SELL Market Ove Bought Red SELL Market At Resistance Red Nothing Signals Close To Channel Middle Line No Nothing Signals Close To VATA Curve No - We should avoid unprofitable signals as below
- Gaps
- Gaps may or may not get filled depending on markets behaviour, time and personality. But VATA has an indicator which show gaps which are close to the current price action. They are shown on the chart in Green (Buy Levels) and Orange/Red (Sell Levels)
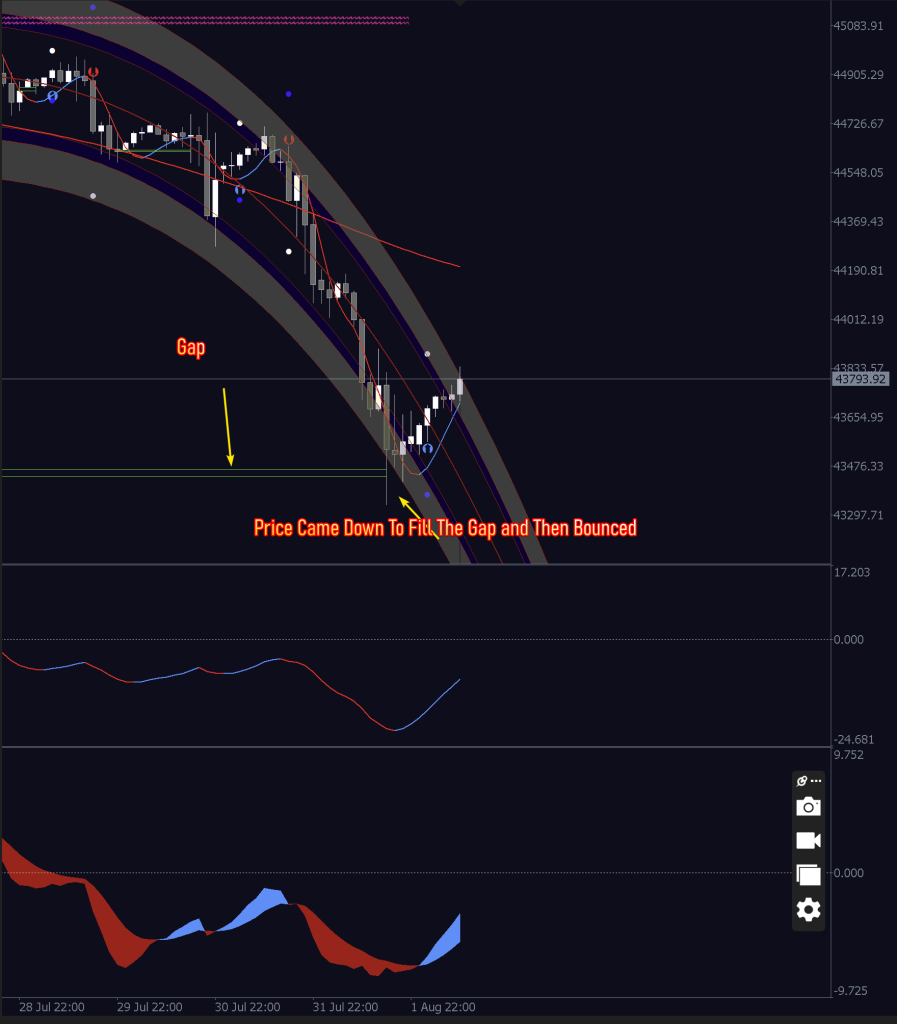
- Price Came Down To Fill The Gap and Then Bounced as you can see in the example above.
- Gaps may or may not get filled depending on markets behaviour, time and personality. But VATA has an indicator which show gaps which are close to the current price action. They are shown on the chart in Green (Buy Levels) and Orange/Red (Sell Levels)
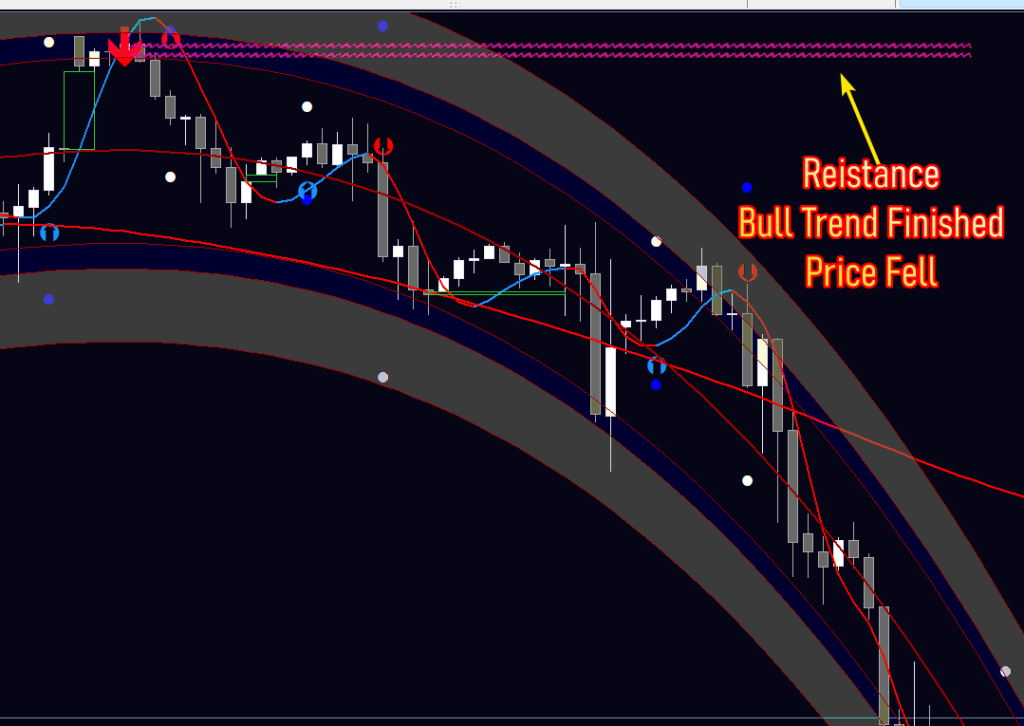
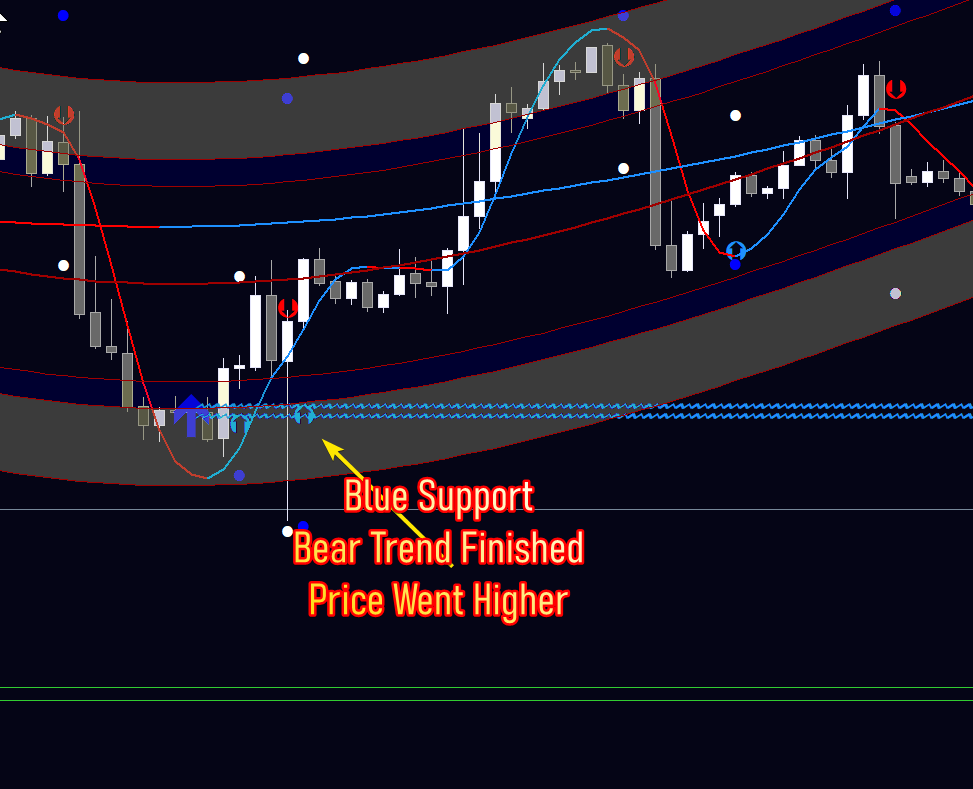
- End Of Trend Support/Resistance Levels: are shown on the chart in Deep Pink Or Red for Resistance and Blue/Green for Support. They indicate that price has reached its trend and very likely going to reverse soon. So ideally we then should wait for a retest and then signal or a signal (arrow) to appear and then plan a trade.
- Deep Pink color means end of the bull trend, price will fall.
- Blue color means end of the bear trend, price will rise
- Deep Pink color means end of the bull trend, price will fall.
VATA Envisage Algo Premium Features: (Separate Purchase/Subscription Required)
- Support/Resistance Zones
- Tool Bar
- Trend Filter
- Candle Filter
- Candle Information
- Clock
- VATA Buy Sell Oscillator
More information and explanation is available here: